The Eye, Unboxed
The last dispatch was philosophy. Three signals, four questions, and a submarine without sonar.
If you're here, you either read Part 1 and came back for the wiring diagram – or you skipped it entirely and want the YAML. Both are valid. I don't judge. Much.
This is the practice. A repository you can clone. Six containers. One docker-compose up. Eight dashboards glowing on your screen before your coffee goes cold.
No vendor. No invoice. No "contact sales for pricing." Open-source. On your machine. Yours.
By the end of this dispatch you will have:
- A running stack – Prometheus, Loki, Tempo, Grafana, Alertmanager – in six containers
- Shell hooks + native OTel integration for three AI CLIs
- Real-time cost tracking in dollars, not just tokens
- Eight dashboards and fifteen alert rules that fire before the email arrives
That's the contract. Let's wire.
The Stack in One Breath
Six containers. One pipe. Three stores. One glass. One alarm.
CLI hooks ──[OTLP HTTP]──► OTel Collector ──► Prometheus (metrics)
                                  │
Native OTel ──[OTLP gRPC]─────────┤──► Loki (logs)
                                  │
                                  └──► Tempo (traces)

Loki recording rules ──[remote write]──► Prometheus

Prometheus ──► Alertmanager (alerts)

                   all roads lead to
                         ▼
                   Grafana (8 dashboards)
Two telemetry channels feed the same collector. Hooks emit OTLP counters – tool calls, events, git context – via HTTP. Native OTel from each CLI provides the rest – tokens, cost, logs, traces – via gRPC. The collector sorts everything into three stores.
Alertmanager watches thresholds. Grafana renders the picture.
Ten-Minute Deploy
git clone https://github.com/shepard-system/shepard-obs-stack.git
cd shepard-obs-stack
./scripts/init.sh
The init script creates a .env from the example, runs docker compose up -d, and waits for every service to pass its health check. Six containers start – OTel Collector, Prometheus, Loki, Tempo, Alertmanager, Grafana. Grafana opens on localhost:3000 (default credentials: admin / shepherd). Eight dashboards in the Shepherd folder, pre-provisioned.
The Eye is open.
But it sees nothing – because nothing is talking to it yet.
An eye without a nerve is just glass.
The Single Pipe
The OTel Collector config is the most important file in the stack. Sixty lines of YAML that decide where every signal goes.
# configs/otel-collector/config.yaml (simplified)
receivers:
  otlp:
    protocols:
      grpc:
        endpoint: 0.0.0.0:4317    # native OTel from CLIs
      http:
        endpoint: 0.0.0.0:4318    # hook metrics (curl)

processors:
  deltatocumulative: # hooks fire DELTA counters (+1 per event)
    max_stale: 10m   # converts them to cumulative for Prometheus

  batch:
    timeout: 5s

exporters:
  prometheus:
    endpoint: "0.0.0.0:8889"
    namespace: shepherd  # every metric gets shepherd_ prefix

  otlphttp/loki:
    endpoint: http://loki:3100/otlp

  otlp/tempo:
    endpoint: tempo:4317

service:
  pipelines:
    metrics:
      receivers: [ otlp ]
      processors: [ deltatocumulative, batch ]
      exporters: [ prometheus ]
    logs:
      receivers: [ otlp ]
      processors: [ batch ]
      exporters: [ otlphttp/loki ]
    traces:
      receivers: [ otlp ]
      processors: [ batch ]
      exporters: [ otlp/tempo ]
Three pipelines. Three destinations. One entry point. Everything that speaks OTLP sends data to port 4317 or 4318, and the collector sorts it out.
The deltatocumulative processor bridges two worlds: hooks fire delta counters – each tool call increments by one, fire-and-forget – but Prometheus expects cumulative counters. Without it, every metric resets to zero after each scrape. The shepherd namespace prefixes everything with shepherd_. One prefix, no ambiguity.
Sixty lines between blindness and sight.
The Hook, Not the SDK
Here is where philosophy meets bash.
The original plan was a Python decorator. An SDK wrapper. Import this, configure that, initialize the other thing. The standard industry approach – which is why I threw it away.
The three AI CLIs I use – Claude Code, Codex, Gemini CLI – all support hooks. Shell commands that fire on events. The hook receives JSON. The hook does whatever it wants with that JSON.
So I wrote the simplest thing that could possibly work.
# hooks/lib/metrics.sh (simplified)
emit_counter() {
  local name="$1"          # tool_calls | events
  local value="$2"         # 1
  local labels_json="$3"   # {"source":"claude-code","tool":"Bash"}

  # Build OTLP attributes from labels
  local attrs
  attrs=$(jq -c '[to_entries[] | {key: .key, value: {stringValue: .value}}]' <<< "$labels_json")

  # Build OTLP Sum metric payload – DELTA temporality, monotonic counter
  local payload
  payload=$(jq -n -c \
    --arg name "$name" --argjson value "$value" \
    --arg ts "$(date +%s)000000000" --argjson attrs "$attrs" \
    '{resourceMetrics: [{
      resource: {attributes: [{key: "service.name", value: {stringValue: "shepherd-hooks"}}]},
      scopeMetrics: [{metrics: [{
        name: $name,
        sum: {
          dataPoints: [{asDouble: $value, timeUnixNano: $ts, attributes: $attrs}],
          aggregationTemporality: 1,
          isMonotonic: true
        }
      }]}]
    }]}')

  curl -s -o /dev/null -XPOST "http://localhost:4318/v1/metrics" \
    -H "Content-Type: application/json" -d "$payload" & disown
}
Thirty lines. bash, curl, jq. Three tools that exist on every Unix machine since the Clinton administration. The hook speaks native OTLP – the same protocol the $200/month SaaS platforms use, except this is thirty lines and a curl to localhost.
The & disown at the end is the entire performance strategy. Fire and forget. The hook pushes, the CLI continues. The agent never waits for observability. Observability waits for no one.
A Python SDK would have been more elegant. This is more reliable. I'll take reliable over elegant every Tuesday – especially the $47 ones.
Three CLIs, One Eye
Three AI CLIs. Three hook mechanisms. One collector. One set of dashboards.
Hooks are only half the story. Each CLI also exports native OpenTelemetry – tokens, cost, logs, traces – through the same collector. Hooks provide what native OTel cannot: git repo context and labeled tool/event counters. Everything else comes from the CLIs themselves.
| Claude Code | Codex CLI | Gemini CLI | |
|---|---|---|---|
| Hooks | PreToolUse, PostToolUse, SessionStart, Stop | notify | AfterTool, AfterAgent, AfterModel, SessionEnd |
| Hook input | stdin JSON | positional arg | stdin JSON (must echo {} to stdout) |
| Hook emits | tool_calls + events | events (turn_end only) | tool_calls + events |
| Native metrics | cost (USD), tokens, sessions, active time | – (via recording rules) | tokens, tool calls, API requests, latency histograms |
| Native logs | API calls, tool decisions, tool results | tokens, model, latency per call | session events |
| Native traces | – | yes | yes |
| Config path | ~/.claude/settings.json | ~/.codex/config.toml | ~/.gemini/settings.json |
Codex is the odd one out – it doesn't emit native metrics, only logs and traces. The bridge: fifteen Loki recording rules that evaluate every minute, extract structured fields from log lines, and remote-write the results to Prometheus. Logs go in. Metrics come out. The Codex dashboard queries PromQL as if Codex emitted native metrics – the bridge is invisible.
Install
./hooks/install.sh
The installer auto-detects which CLIs are present, backs up existing configs, injects the bash hooks and enables native OTel export – all via non-destructive jq merge. To verify the full pipeline, run ./scripts/test-signal.sh. Eleven checks, pass/fail. If the pipe leaks, you'll know which joint.
What the Eye Watches
Two hook metrics flow into Prometheus. shepherd_tool_calls_total labeled by source, tool, tool_status, git_repo. shepherd_events_total labeled by source, event_type, git_repo. That's all the hooks produce. The dimensions are what make them useful.
Cost comes from native OTel. Here's what the Eye saw in one real session – this article being written:
- Input tokens: 469
- Output tokens: 26,996
- Cache reads: 26,364,893
- Cost: $47
Twenty-six million cached tokens. That's not a typo. A long session with Opus means the context gets re-read on every turn. Cache reads are cheap – $1.50 per million instead of $15 for fresh input – but twenty-six million of anything adds up.
The $47 Tuesday would have been a $5 Tuesday with this dashboard open. Not because the dashboard changes the cost. Because the dashboard changes the behavior.
You don't run an agent for eight hours when you can see the meter running.
You can't optimize a black box. You can optimize glass.
Eight Dashboards
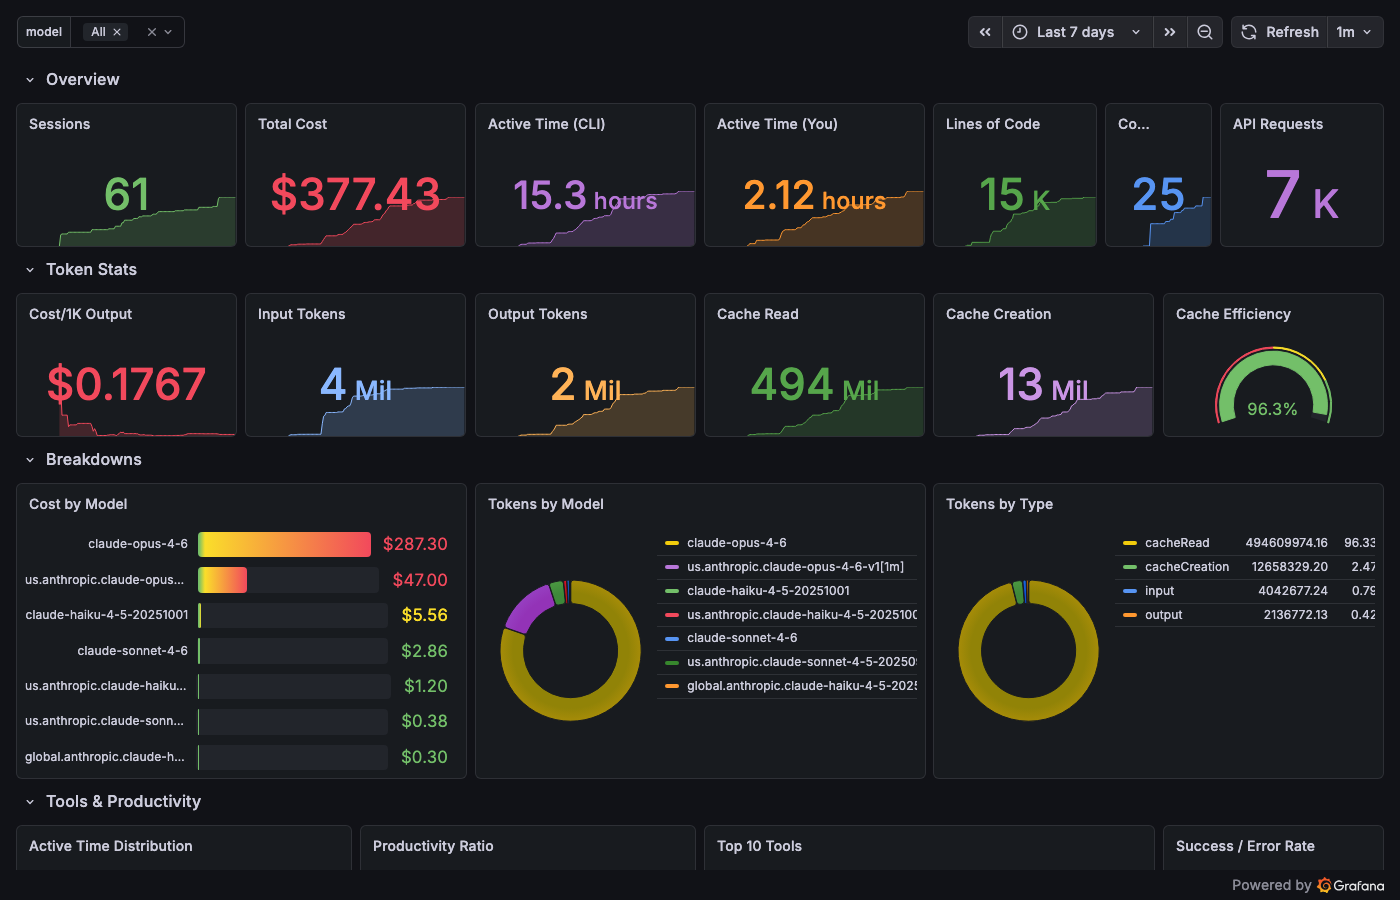
Four unified dashboards answering the four questions from Part 1. Three provider deep dives. One session timeline. The full eight: Cost, Tools, Operations, Quality, Claude Code Deep Dive, Codex Deep Dive, Gemini Deep Dive, Session Timeline.
Cost – "How much?"
sum(increase(shepherd_claude_code_cost_usage_USD_total[$__range]))
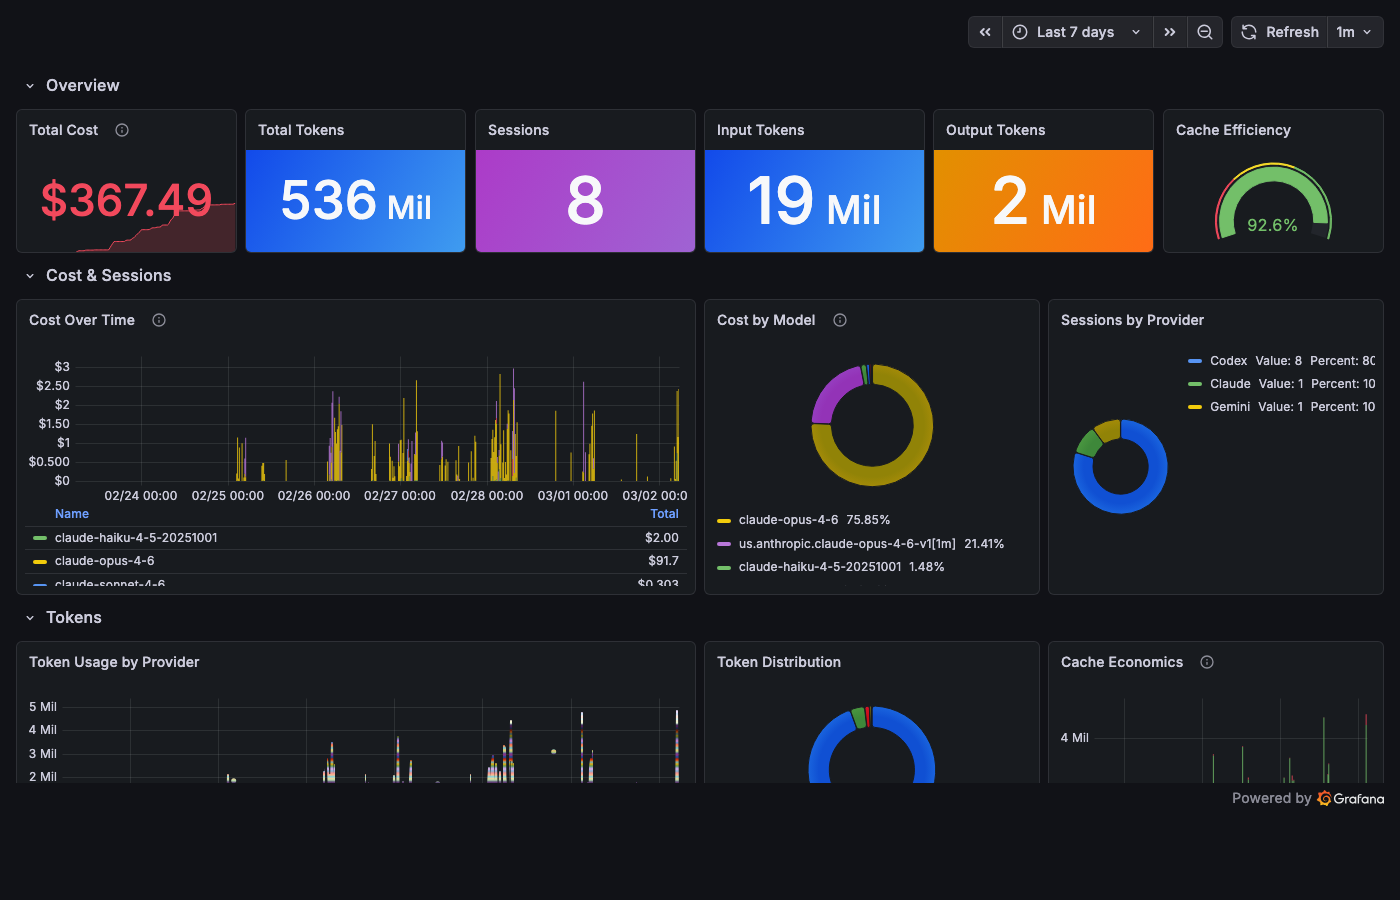
One stat panel. Green below $5. Yellow at $5. Red at $20. The color tells you everything before the number does. Cost by model, cache efficiency, token usage over time, and a session details table with every session's bill.
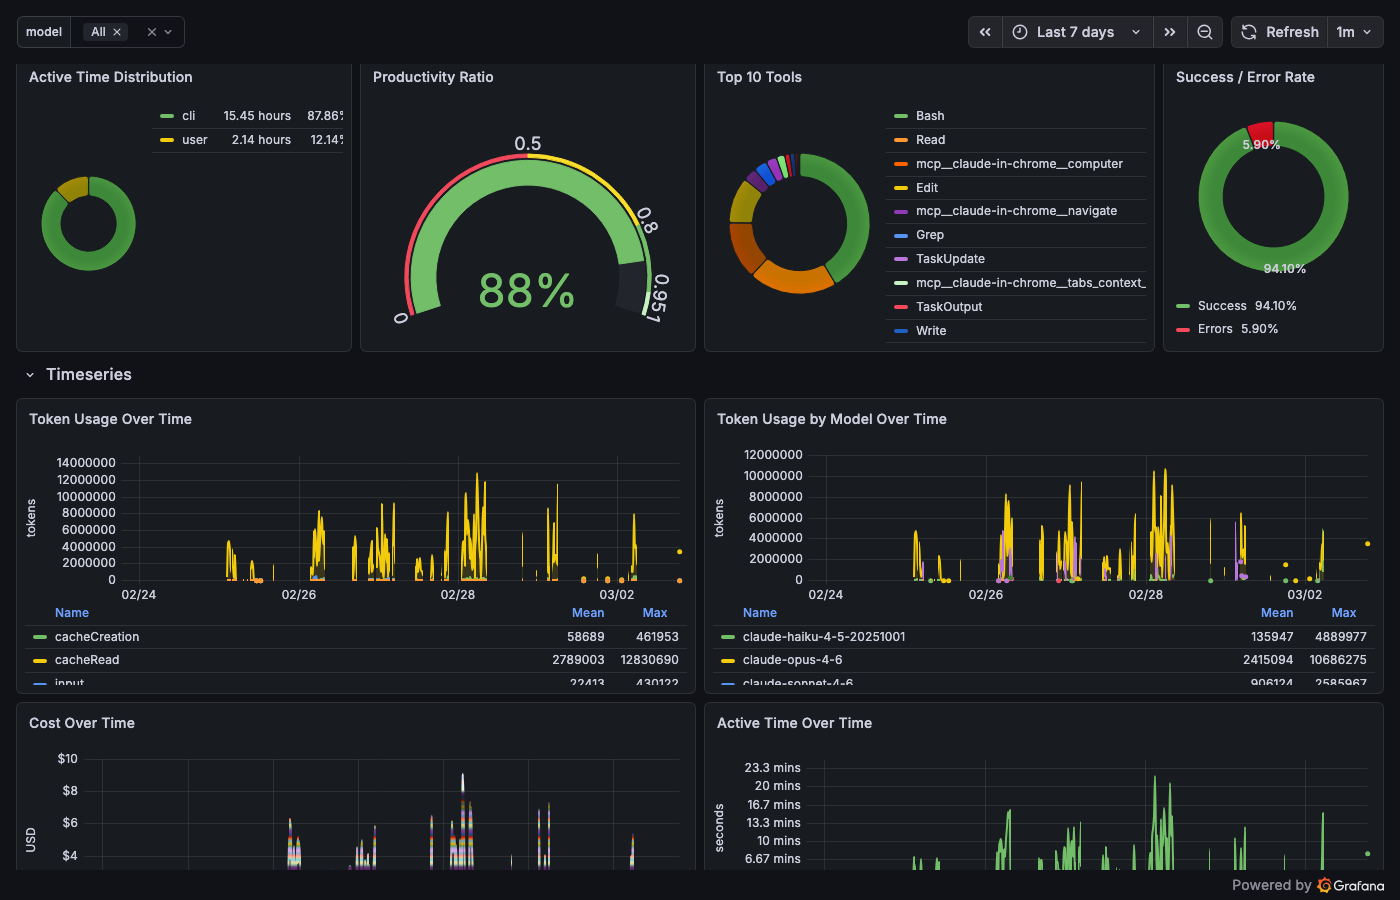
Tools – "Who is wandering?"
topk(10, sum by (tool) (increase(shepherd_tool_calls_total[$__range])))
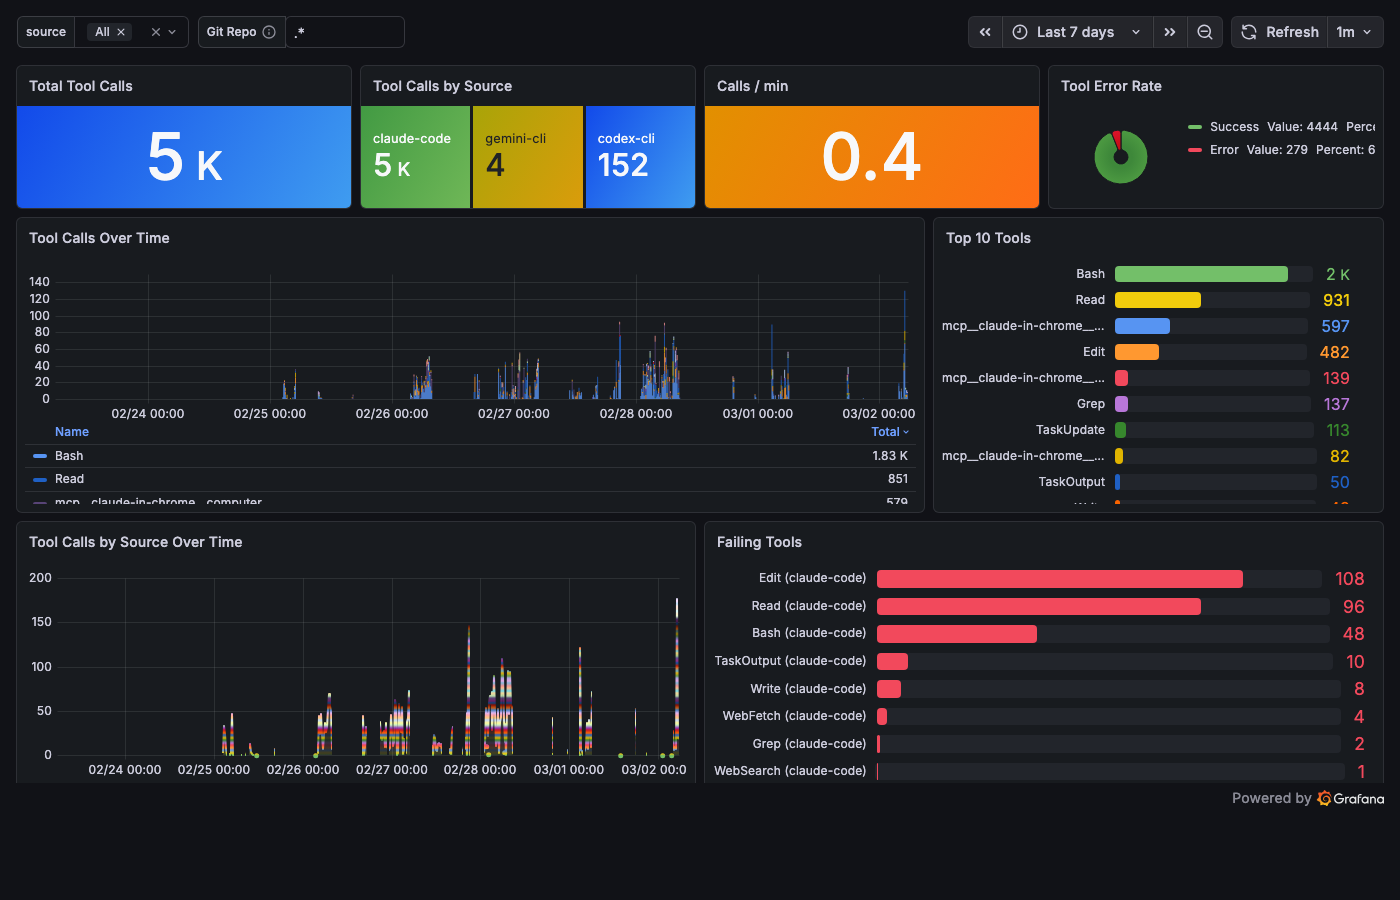
Total calls, calls per minute, top 10 tools ranked by frequency, and the Failing Tools bar gauge – tool name, error count, sorted by shame. Bash leads with the most errors in my stack. Not because Bash is broken – because Bash is where agents try things that don't work.
The error rate is the honesty metric. An agent with zero errors is either perfect or silent about its failures.
Operations – "What's happening now?"
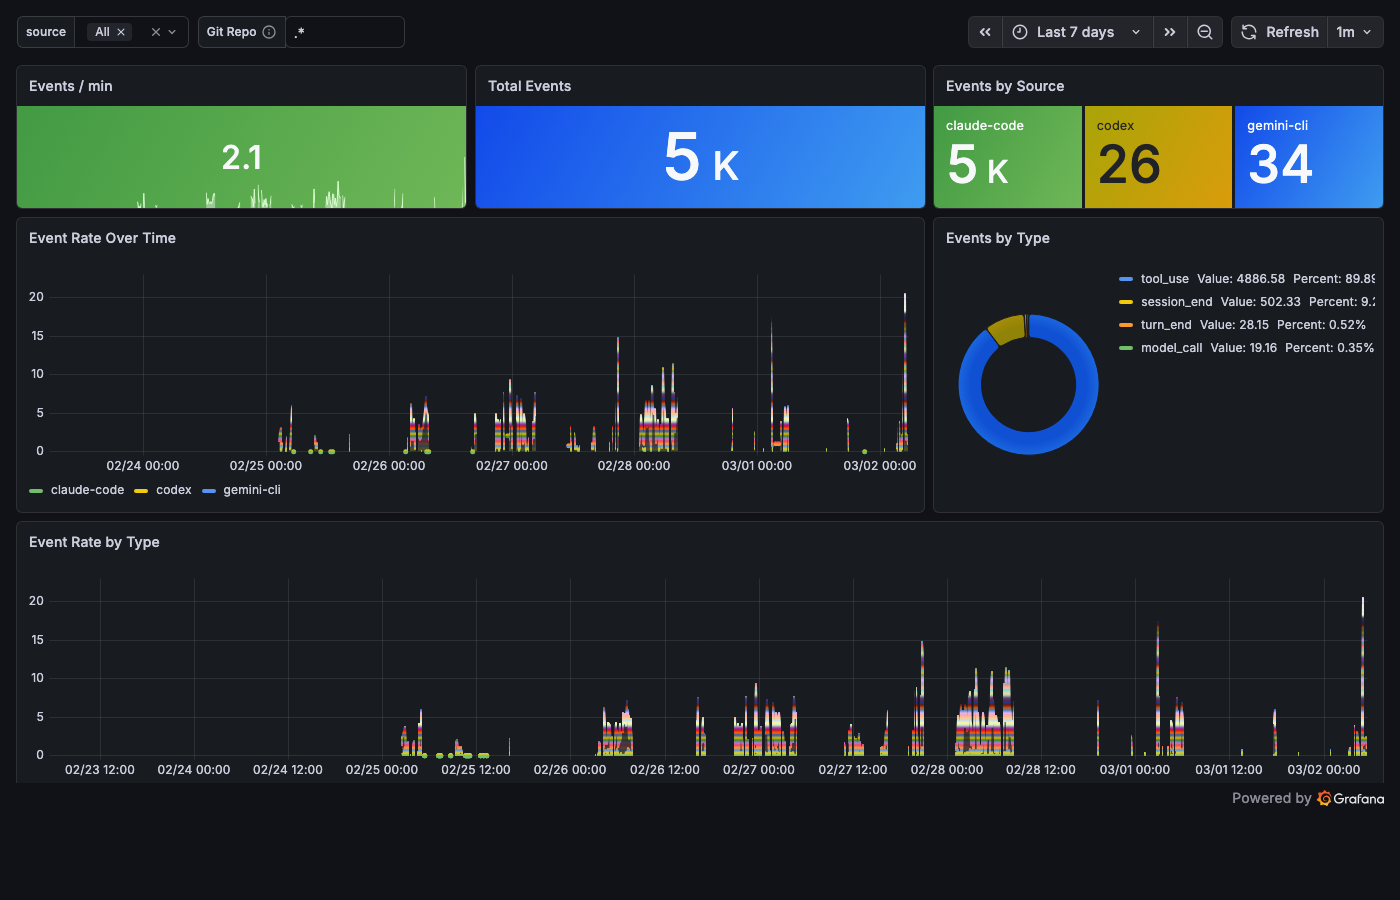
Events per minute. Source breakdown. A raw Loki log stream at the bottom – when you're debugging, you need a scrolling terminal, not a dashboard. This is that terminal, in Grafana.
Quality – "Is the system getting better?"
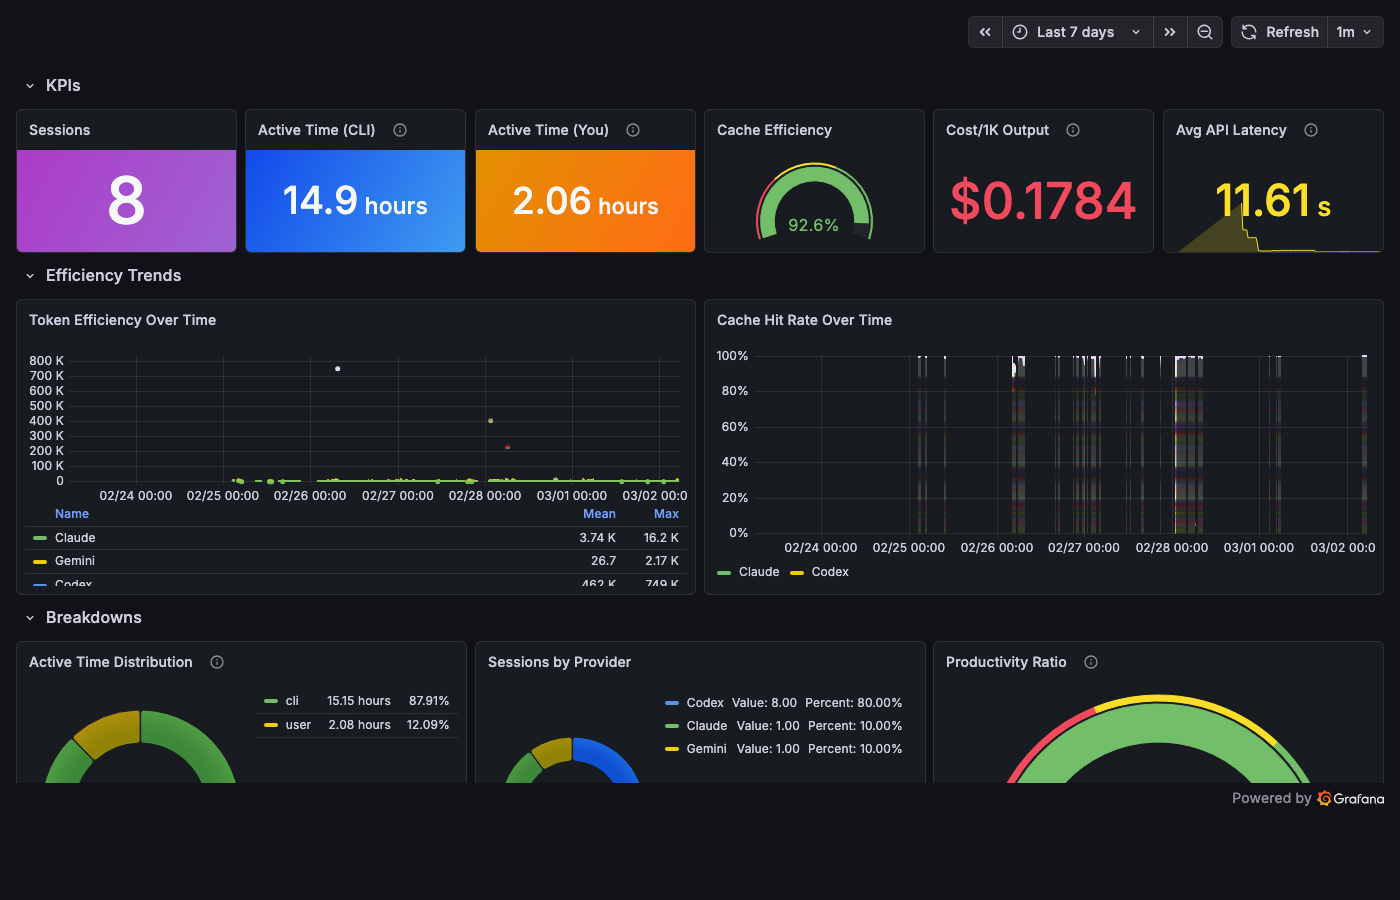
Session counts over time. Cache hit rate gauge. In my stack right now: 92.6% cache efficiency across 8 sessions. The dashboard didn't change the system. The system changed because someone was looking.
Nobody checks this dashboard daily. It's the most important one.
Deep Dives
Each provider gets its own deep dive. Claude Code – 27 panels: tokens, cost, cache, tool decisions, active coding time. Codex – 26 panels: sessions, API latency percentiles, reasoning token ratio (twenty-three PromQL panels powered by those recording rules). Gemini – 31 panels: token breakdown by type, latency heatmap, tool call routing. The most detail goes where the most telemetry lives.
Session Timeline
The eighth dashboard does something the others can't: it reconstructs time.
Each CLI's session-end hook parses the session log into synthetic OTLP traces and ships them to Tempo. The Claude parser alone – 265 lines of pure jq – reconstructs tool call waterfalls, MCP timing, sub-agent invocations, and context compaction events from raw JSONL. Three parsers, one unified span schema, one Tempo backend.
Click a trace ID and you're in Grafana Explore, looking at the full waterfall of a thirty-minute coding session. The separate reality behind the agent's cheerful "task completed successfully."
The timeline answers a question no metric can: what happened inside that session?
The Nervous System
Dashboards are for the hours when you're watching. Alerts are for the hours when you're not.
Fifteen alert rules, three tiers:
| Tier | Rules | What it catches |
|---|---|---|
| Infrastructure | 6 | OTelCollectorDown, export failures (spans, metrics, logs), memory limits |
| Pipeline | 4 | LokiDown, TempoDown, PrometheusTargetDown, LokiRecordingRulesFailing |
| Business logic | 5 | HighSessionCost (>$10/hr), HighTokenBurn (>50k tok/min), HighToolErrorRate, SensitiveFileAccess, NoTelemetryReceived |
Inhibit rules suppress the noise: when the collector is down, business-logic alerts stay quiet.
SensitiveFileAccess fires when an agent touches your .env, credentials, or private keys. You'll know before the commit does.
That $47 session? HighSessionCost would have fired at minute twelve. Not from an email at 9 AM – from a Telegram message while the agent was still running.
Monitoring watches the screen. Observability pulls the plug.
What the Eye Still Can't See
The Eye sees what's instrumented. If a CLI doesn't support hooks, it's invisible. Every new CLI needs a hook script. Every new event type needs a jq extraction. The wiring is manual.
Retention is seven days for logs and traces – enough to debug yesterday, not enough to spot trends over months. Prometheus metrics survive longer, but individual session context fades. You see the forest, lose the trees.
Claude Code doesn't export native traces – the table says "–" and it means it. Session reconstruction relies entirely on log parsing. If Anthropic adds trace export tomorrow, the stack is ready. Until then, the 265-line jq parser carries the weight.
Cost tracking is native – each CLI reports its own spending. If a CLI's internal pricing table is wrong, the dashboard inherits the error. Trust but verify with your provider's billing page.
What Comes Next
The Eye is open. Six containers, one pipe, eight dashboards, fifteen alerts, and a meter that counts dollars while you sleep.
But dashboards don't prevent the $47 session – they just make it visible. The Eye shows patterns: an agent that reaches for Bash twelve times when a single Edit would do. A model that costs ten dollars for a task the smaller model solves for forty cents. Three CLIs, three separate tool registries – each agent wiring its own plumbing.
The Eye watches. It doesn't intervene.
Observability without governance is surveillance without consequence. You see the agent reach for Bash twelve times. You see the meter climb. You see the pattern – and the pattern doesn't care that you're watching.
What if every agent – Claude, Codex, Gemini – reached for the same toolkit? One tool registry. One permission layer. One gate that logs every call, routes every request, and can say no when the rules say no.
The Eye needs a gate.
Next dispatch: The Gate – one MCP hub, three CLIs, unified tooling.